September 14, 2014
Correlations and Scatter Plots
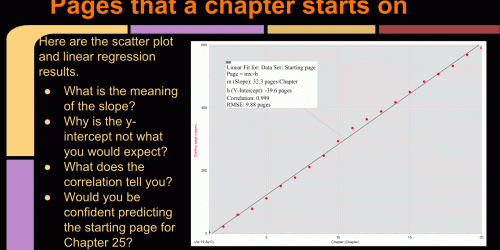
After a couple of hand-graphs, my students use their TI 83/84 calculator for graphing. We set the calculators so they give an “R squared” correlation, which we often use to help determine which regression type (linear, quadratic, power) fits the data the best. Many of my students have a hard time understanding the nature of the correlation, and I have...